Beyond the Scoreline: Unpacking Football’s Elite Teams Through Expected Goal (xG) Ratios
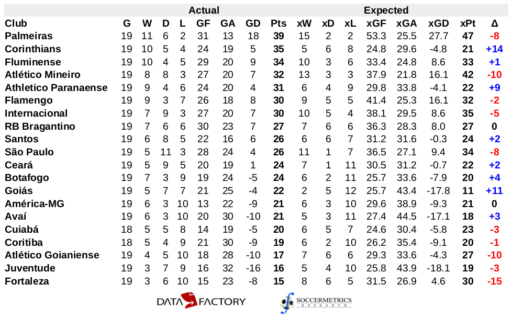
Football, the beautiful game, has always been a theatre of raw emotion, breathtaking skill, and unpredictable outcomes. For decades, the narrative was driven by simple metrics: goals scored, clean sheets, wins, losses, and draws. While these remain the ultimate arbiters of success, the advent of advanced analytics has peeled back layers of performance, revealing a deeper truth about how teams truly dominate. Among these revolutionary metrics, Expected Goals (xG) and, more importantly, Expected Goal Difference (xGD) or xG Ratios, stand out as the most powerful indicators of underlying performance and sustainable success.
This article delves into the world of xG ratios, exploring what they signify, how they are calculated, and which types of football teams consistently exhibit the best figures, signaling their true dominance beyond mere results.
The xG Revolution: A Deeper Look at Chance Quality
Before diving into ratios, it’s crucial to understand xG itself. Expected Goals (xG) is a statistical metric that quantifies the probability of a shot resulting in a goal. It assigns a value between 0 and 1 to every shot taken, based on a multitude of factors, including:
- Location of the shot: Shots from closer to the goal, especially centrally, have a higher xG.
- Body part used: Headers generally have a lower xG than shots with the foot.
- Type of assist: Through balls, crosses, and cut-backs influence xG.
- Defensive pressure: The number of defenders between the shooter and the goal.
- Game state: Open play, set pieces, counter-attacks.
- Angle to goal: The narrower the angle, the lower the xG.
- Rebound/follow-up shot: These often have higher xG due to proximity.
By aggregating the xG values of all shots a team takes in a game, we get their "Expected Goals For" (xG For). Similarly, by summing the xG values of all shots conceded, we get "Expected Goals Against" (xG Against or xGA).
Unlike traditional metrics like "shots on target," which treat all shots equally, xG provides a qualitative assessment. A speculative 30-yard effort might have an xG of 0.02, while a tap-in from two yards might be 0.90. This distinction is vital for understanding true attacking threat and defensive solidity.
The Power of the xG Ratio: Expected Goal Difference (xGD)
While xG For tells us how many quality chances a team creates, and xGA tells us how many quality chances they concede, the real insight comes from their combination: the Expected Goal Difference (xGD). This is simply xG For minus xGA. A positive xGD indicates that a team is, on average, creating higher quality chances than they are allowing their opponents.
Think of xGD as the "net quality of chances." A team with a high positive xGD is consistently out-creating and out-defending its opponents in terms of shot quality. This is where the concept of "xG ratios" truly shines, as it directly reflects a team’s dominance in the run of play.
Why is a strong xGD so important?
- Predictive Power: Over a large sample size (e.g., a full season), xGD is a far better predictor of future results and league position than actual goal difference. Actual goals can be skewed by luck, individual errors, or moments of brilliance (e.g., a wonder goal from outside the box that had a low xG). xGD cuts through this variance, revealing a team’s underlying performance level.
- Sustainability: Teams with consistently high xGDs are not relying on luck or individual heroics to win. They are performing at a level that is statistically sustainable. They are generating high-probability chances and suppressing opponent opportunities repeatedly.
- Coaching Effectiveness: A strong xGD often indicates excellent tactical setups, effective pressing schemes, organized defense, and efficient attacking patterns. It’s a testament to the coaching staff’s ability to maximize their squad’s potential.
- Identifying Over/Underperformers: Teams with a significantly higher actual goal difference than their xGD might be considered "lucky" or overperforming. Conversely, teams with a much lower actual goal difference than their xGD might be "unlucky" or underperforming, suggesting better results are likely to come if their underlying performance holds.
Architects of Dominance: Teams with Elite xG Ratios
While specific teams and their xG numbers fluctuate season by season, certain archetypes and historical examples consistently demonstrate superior xG ratios. These are the teams that truly dominate the flow of the game, irrespective of the final score.
1. The Positional Play Masters (e.g., Pep Guardiola’s Manchester City, Prime Barcelona):
These teams prioritize suffocating possession, often maintaining 65-75% of the ball. Their philosophy is to control the game through superior ball retention, systematically breaking down defenses with intricate passing patterns. This approach naturally leads to high xG For and remarkably low xGA.
- High xG For: By patiently circulating the ball, drawing opponents out of position, and then executing precise through balls or cut-backs into dangerous areas, they create numerous high-quality chances. They don’t just shoot often; they shoot from optimal locations.
- Low xGA: The defensive benefit of possession is immense. By keeping the ball, they starve the opponent of possession, limiting their opportunities to even attempt shots, let alone high-quality ones. Their counter-press is also key, winning the ball back quickly when it’s lost, preventing transitions that might lead to dangerous situations.
- Example: Manchester City under Pep Guardiola consistently tops xG charts in the Premier League. Their ability to generate 2.0+ xG per game while limiting opponents to 0.5-0.8 xG per game results in an incredible xGD of +1.2 to +1.5 per match, year after year. This dominance is why they consistently win titles.
2. The High-Pressing Powerhouses (e.g., Jürgen Klopp’s Liverpool, Hansi Flick/Julian Nagelsmann’s Bayern Munich):
These teams employ an intense, organized high press (Gegenpressing) to win the ball back quickly in advanced areas. This strategy aims to disorganize the opponent’s defense and create chaotic, high-xG counter-attacking opportunities.
- High xG For: Winning the ball high up the pitch often leads to immediate attacking transitions against an unsettled defense. This creates clear-cut chances from central areas, significantly boosting their xG. Their rapid attacks and willingness to shoot also contribute.
- Low xGA: The effectiveness of their press means opponents struggle to build up play from the back. Long balls are often easily dealt with, and any attempts to play through the lines are met with swarming pressure. This limits the quality of chances their opponents can create.
- Example: Liverpool in their peak years under Klopp were renowned for their relentless pressing. While they might sometimes concede more shots than City due to their open style, the quality of those shots was often low. Their xGD remained incredibly strong, driven by their ability to generate numerous high-value chances through turnovers and quick attacks.
3. The Tactical Chameleons/Adaptive Geniuses (e.g., Some Diego Simeone Atletico Madrid teams, depending on the season, or top national teams):
While less common for consistently elite xG ratios (as defensive teams often prioritize limiting xGA over maximizing xG For), some highly adaptable teams manage to strike a balance. They might not dominate possession, but they are incredibly efficient in both boxes.
- Efficiency: They are clinical with the chances they create (often fewer, but high xG), and exceptionally disciplined in defense, ensuring opponents struggle to get into high-xG areas.
- Example: While Atletico Madrid’s xG For might not always be sky-high, their xGA is consistently among the lowest in Europe. In their title-winning seasons, they managed to couple this defensive solidity with enough efficient attacking play to maintain a healthy xGD, even if it wasn’t as eye-popping as the possession-based giants.
4. The Emerging Analytics-Driven Sides (e.g., Brighton & Hove Albion under Roberto De Zerbi, Brentford):
These teams, often operating with smaller budgets, leverage data analytics heavily to identify tactical approaches and player profiles that maximize their xG ratios.
- Smart Recruitment: They sign players who fit a specific system designed to generate high-xG shots and prevent opponents from doing the same.
- Coaching Philosophy: Coaches like De Zerbi focus on patterns of play that lead to high-quality chances, even if it involves risky build-up. They accept the occasional error in pursuit of consistent high-xG opportunities.
- Example: Brighton has consistently punched above its weight in terms of underlying numbers. Their xGD often places them significantly higher in the league table than their actual position, indicating a strong foundation for future success. This highlights xG’s predictive power even when results don’t immediately align due to finishing variance or bad luck.
Key Factors Driving Superior xG Ratios
Beyond the broad archetypes, several underlying factors contribute to a team’s consistently high xG ratio:
- Elite Coaching: A clear tactical philosophy that is effectively implemented and adapted. Coaches who understand how to create space, exploit weaknesses, and organize a robust defense are paramount.
- Player Quality & Synergy: Not just individual brilliance, but how players fit together. Clinical finishers boost actual goals from xG, but creative midfielders and intelligent attackers are essential for generating high-xG chances in the first place. Strong, mobile defenders and disciplined midfielders are crucial for limiting xGA.
- Tactical Discipline: Players must consistently adhere to the team’s defensive and offensive structures, whether it’s pressing triggers, defensive shape, or attacking movements.
- Set-Piece Prowess: Both attacking and defending set pieces can significantly impact xG and xGA. Teams that create high-xG chances from corners and free-kicks, and defend them well, gain an advantage.
- Squad Depth: The ability to rotate players without a significant drop in quality ensures that the team can maintain its high xG ratio over a long season, especially when competing on multiple fronts.
- Data Integration: Modern elite teams heavily rely on data analysts to identify trends, optimize strategies, and inform recruitment decisions, all aimed at improving their xG profile.
The Nuances and Limitations of xG
While xG is an incredibly powerful tool, it’s not without its nuances and limitations:
- Goalkeeper Performance: xG doesn’t account for the quality of the save. A team might have a low xGA but concede more goals if their goalkeeper is underperforming. Conversely, an elite goalkeeper can make a team look defensively better than their xGA suggests.
- Individual Brilliance/Errors: xG measures the probability of a goal based on the shot, not the outcome based on a world-class save or a glaring miss. A Lionel Messi wonder goal from a low-xG shot will still only be counted as a low-xG event.
- Game State: xG models generally don’t fully account for situations like a team playing with 10 men, chasing a goal in the dying minutes, or parking the bus with a lead. These situations can naturally skew xG numbers.
- Model Differences: Various data providers (Opta, StatsBomb, FBref) use slightly different xG models, leading to minor variations in numbers.
- Long-term vs. Short-term: xG is most reliable over a large sample size (e.g., half a season or more). In individual games, variance is still present, and the team with the higher xG doesn’t always win.
Conclusion
The evolution of football analytics, spearheaded by metrics like Expected Goals, has transformed our understanding of team performance. By focusing on xG ratios, particularly Expected Goal Difference, we move beyond the immediate gratification or disappointment of the scoreline and delve into the underlying quality of play.
Teams that consistently exhibit the best xG ratios are not just lucky; they are fundamentally superior in how they create high-quality chances and how they prevent their opponents from doing the same. They are the tactical masterminds, the highly drilled units, and the truly dominant forces in modern football. While the game will always retain its unpredictable charm, xG provides a robust framework for identifying sustainable excellence, offering fans, analysts, and clubs alike a more profound appreciation for the intricate beauty of consistent, high-level performance. As analytics continue to mature, the pursuit of superior xG ratios will remain a cornerstone of success for any ambitious football club.


